COUNTERFACTUAL PREDICTION: THE MOST IMPORTANT TASK FOR DATA SCIENTISTS?
MATS JULIUS STENSRUD, FOR ARITHMOX
Data scientists often deal with technical activities such as managing, processing and analysing data. However, the ultimate aim is usually to answer a substantial question:
Would the new product design increase the revenue? Would the new therapeutic decrease mortality? Would the new law prevent crime?
I think it is crucial to be explicit about the substantial question – that is, the target of inference – before any technical data science activity is initiated. Often this substantial question is described as “finding patterns”, “gaining insight” or “improving the understanding” of some phenomenon [1].
However, what do these vague terms really mean? In a recent article, Hernan and colleagues [1] explain why the research question – the target of inference – should be explicitly stated. Their key point is that different questions require substantially different assumptions about the data generating mechanism, and in turn different analyses. In particular, they define 3 categories of inferential tasks that are distinct: description, prediction and counterfactual prediction. I think the counterfactual prediction is particularly interesting, because I am convinced that counterfactual predictions are our guide to real-life decision making. Here I will briefly describe description and prediction, and then give some more details on how to think about counterfactual predicitions.
Description.
A descriptive study only aims to describe the data at hand. For example, we may aim to describe how many customers visit a website every day, or we may study how many suffer from diabetes in Indonesia. Descriptive tasks are conceptually straightforward, and these tasks can often be successfully accomplished with modern learning algorithm, usually without making assumption that require expert knowledge on the research question.
Prediction.
Prediction is the task of performing a mapping from some features of the world, the input, to some other features of the world [1], the output, and this task can briefly be divided into 3 steps:
- Obtain a (large) dataset that contains inputs and outputs.
- Create a map between inputs and outputs.
- Use a metric to assess how the mapping performs.
We may for example be interested in predicting the weather some days ahead, using a large set historical weather observations. Or we may aim to predict the stock marked tomorrow, based on available data. When doing predictions, we have are only observers and we do not intervene with anything in the system.
In particular, if we have a data matrix of inputs, X, we may aim to use X to predict the distribution of outcomes, Y , that is, we study
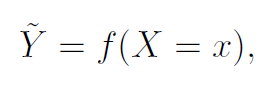
Where f is an arbitrary functions, e.g. derived from some machine learning algorithm, that maps inputs to outputs.
Counterfactual prediction.
The idea of counterfactual prediction is to consider output in a hypothetical setting where some features of today’s world were changed. Heuristically, scientific questions based on counterfactual predictions can be phrased as What would happen if -questions. For example, we may aim to predict what would happen to the number of visits on our website if we updated the layout. Or we may aim to predict what would happen to the number of items sold, if we bought an online advertisement.
The idea of counterfactual prediction is to consider output in a hypothetical setting where some features of today’s world were changed. Heuristically, scientific questions based on counterfactual predictions can be phrased as What would happen if -questions. For example, we may aim to predict what would happen to the number of visits on our website if we updated the layout. Or we may aim to predict what would happen to the number of items sold, if we bought an online advertisement.
Or we may want to know would would happen to the number of lung cancer cases if everybody stopped smoking. It’s a common human endeavour to consider what would happen if -questions, but formally answering these questions can be tricky. Indeed, in some settings we can easily assign units to different exposures at random, and then compare the outcomes in each exposure arm, which will help us to make good counterfactual predictions. Among data scientists, this strategy is often called A/B-testing, which is a completely analogous to randomized controlled trials in medicine and economics.
Unfortunately, such experiments are infeasible or unavailable in many situations: experiments are often time consuming, expensive and sometimes unethical. For example, to assess the effect of smoking cigarettes on dementia, it would be unethical to randomly assign subjects to smoke. Or to assess the effect of gaining weight in late adulthood, it would be hard to imagine a trial in which subjects are randomly assigned to become overweight. In settings where randomized experiments are unavailable, it’s tempting to use nonexperimental data, often derived from large, publicly available dataset. However, counterfactual prediction from observational data requires great care, and such predictions cannot be fully data-driven; we also need expert knowledge about the causal structure.
To think formally about causal inference, and thus to approach what would happen if questions, we must be explicit about our assumptions, and in this regard a formal causal model is helpful [2, 3]. The causal model allows us i) to define causal contrasts, that is, well-defined mathematical measures of causal effects, and ii) to evaluate whether these causal contrasts can be identified from the observed data; here, identified means that the functional of interest can be expressed as functions of the observed data only. To fix ideas, assume that you’ve been asked to assess the effect of alcohol consumption on mortality, and you have access to a large data set of electronic health record. To make progress, the first thing is to clarify the research question, which is currently ambiguously stated; we must clarify the characteristics of the target group and the target intervention, so that we can be explicit about
i) How much daily alcohol should the eligible subjects drink? At which age? For how long? Are the target individuals otherwise healthy?
A convenient way to clarify these questions is to clearly specify the experiment that corresponds to the research question. In medicine, it’s often denoted to emulate a target trial [4], that is, to specify the A/B test of interest. Now, assume that we’ve clarified the research question: our hypothetical experiment includes healthy individuals between 60 and 65 years old who are randomly assigned to drinking 2 glasses of wine or no alcohol daily, and the individuals are followed up for 10 years. The next challenge is to emulate this experiment from the electronic health records. A thorough description about how analyse the data is beyond the scope of this post, because it is far from a trivial pursuit. However, good advice is found in Robin and Hernan’s textbook [5] and Pearl’s textbook [2]. Key components are to adjust for common causes of the alcohol consumption and mortality, identify possible non-adherence to the protocol of drinking 2 glasses of wine vs no glasses of wine, and to deal with losses to follow-up (missing data).
REFERENCES
[1] Miguel A Hernan, John Hsu, and Brian Healy. Data science is science’s second chance to get causal inference right: A classification of data science tasks. arXiv preprint arXiv:1804.10846, 2018.
[2] Judea Pearl. Causality. Cambridge university press, 2009.
[3] James Robins. A new approach to causal inference in mortality studies with a sustained exposure period|application to control of the healthy worker survivor effect. Mathematical modelling, 7(9-
12):1393{1512, 1986.
[4] Miguel A Hernan and James M Robins. Using big data to emulate a target trial when a randomized trial is not available. American journal of epidemiology, 183(8):758{764, 2016.
[5] Miguel A Hernan and James M Robins. Causal inference. CRC Boca Raton, FL, 2010.
arithmox, arithmox.ai, counterfactual, data, julius, mats, mats julius stensrud, paper, prediction, research, science, statistics, stensrud, technology
